Even the best early-childhood programs cannot guarantee educational success.
“To expect effects to be sustained throughout childhood and adolescence, at their initial high levels, in the absence of continued high-quality schooling,” says Jeanne Brooks-Gunn, a professor of education at Teachers College, Columbia University, “is to believe in magic.”
Read the related story, Grades Put on Hold as Indicators Evolve
Last year, Quality Counts looked at the progress states have made in raising student achievement in elementary and secondary schools over more than a decade as measured by the National Assessment of Educational Progress, or NAEP, often known as “the nation’s report card.”
When looked at over that longer time period, student achievement has gotten better, particularly in mathematics and for low-income and African-American and Hispanic students. But reading achievement has barely budged since 1992. And high school achievement remains flat.
Moreover, achievement gaps by race and class remain daunting: Near the end of high school, African-American and Latino students have reading and math skills that are virtually the same as those of white 8th graders.
Large proportions of students—particularly poor and minority teenagers—also fail to graduate from high school within four years. And even those who do may not be ready for college. Despite calls for more young people who are trained in math and science, for example, just over half of high school students took upper-level math courses in 2004, and just one in three took upper-level science courses.
| Data Download | |||
|---|---|---|---|
|
To help provide a picture of K-12 performance across states, Quality Counts 2007 includes an achievement index that assigns points to each state based on whether its students are significantly above or below the national average on 15 indicators: the percent of students scoring at the “proficient” level or higher on NAEP reading and math tests in grades 4 and 8; the average change in NAEP scores in both grades and subjects from 2003 to 2005; the gap in NAEP math performance between 8th graders who are and are not eligible to receive subsidized school meals, and the change in that gap between 2003 and 2005; the high school graduation rate and the change in that rate between 2000 and 2003; the number of Advanced Placement scores of 3 or higher (out of a possible 5) for every 100 public high school students, and the change in that figure from 2000 to 2005; and the percent of 8th graders scoring at the “advanced” level on the NAEP math exam.
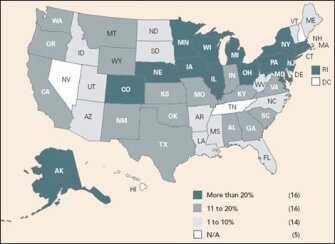
- Graduation-Rate Advantage The socioeconomic makeup of districts is strongly related to graduation rates. Low-poverty districts, where the percentage of students eligible for free or reduced-price lunches is below the national average, tend to have much better graduation rates than high-poverty districts (those in which the poverty level exceeds the national average of 38.7 percent). But that graduation-rate advantage is much more pronounced in some states than in others.
- Math-Performance Disparities Early disparities in math performance by race and ethnicity persist throughout elementary and high school. Toward the end of high school, black and Hispanic teenagers score at levels slightly below non-Hispanic white 8th graders, based on data from the National Assessment of Educational Progress.

Massachusetts, New Jersey, and Vermont are the top performers on the achievement index, while Mississippi, West Virginia, New Mexico, Hawaii, and Alabama perform at the bottom.
The index underscores the conclusions of a recent paper by economists James J. Heckman and Flavio Cunha of the University of Chicago: “Early investment in cognitive and noncognitive skills lowers the cost of later investment by making learning at later ages more efficient,” they write. But they add: “Early investments must be followed up by later investments in order to be effective.”